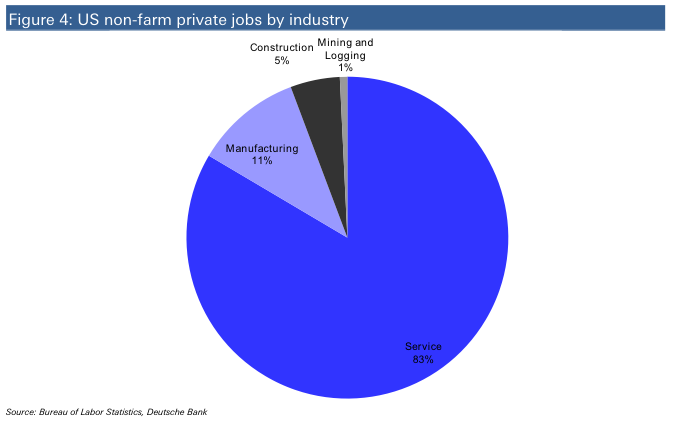
Manufacturing dominates the S&P, but services dominate US GDP
Services make up more than 80% of US private sector jobs and 60% of US GDP. The slow recovery in services has been the main reason behind lackluster US GDP growth. But S&P 500 profits have rebounded quickly and strongly owing to their bigger exposure to commodities, capex and exports. Although not big enough to make for strong overall US GDP or employment by itself, we expect manufacturing to remain a bright spot within US GDP and should be of great benefit to non-financial S&P EPS. Experts point to the great manufacturing renaissance that is coming for the U.S. economy, thanks to rising manufacturing and labor costs abroad.
------
The year-over-year (YoY) decline in Case-Shiller prices has been getting smaller all year, and the Zillow forecast suggests the YoY decline will be smaller still in April - and be the smallest YoY decline since the expiration of the housing tax credit. At the current pace of improvement, it looks like the YoY change will turn positive in either the August or September reports. It is important to remember that most of the sales that will be included in the August report have already been signed. The August Case-Shiller report will be a 3 month average of closing prices for June, July and August - and the contracts are usually signed 45 to 60 days before closing. So just about all of the contracts that will close in July have been signed, and probably many of the contracts that will close in August have already been signed.
------
Egy cikk arról, hogy milyen legendákat hallottak Amerikáról az emberek, és mivel szembesültek, amikor kiköltöztek. Érdemes elolvasni.
------
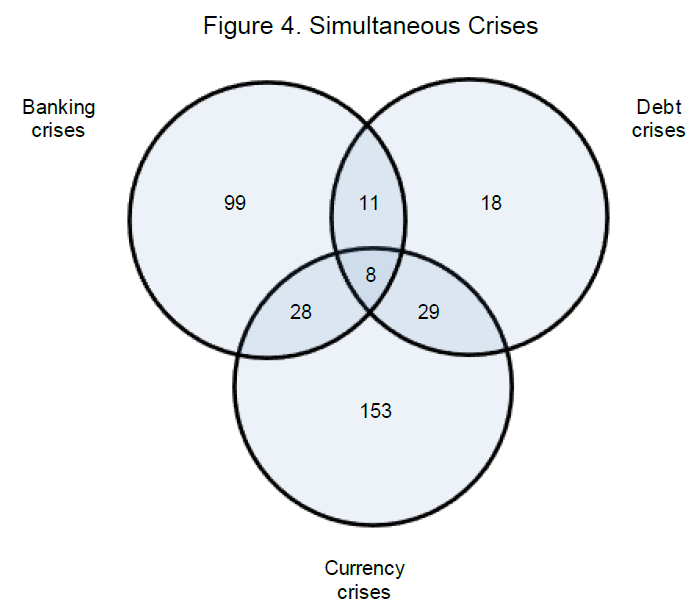
Nézzük mit mond:
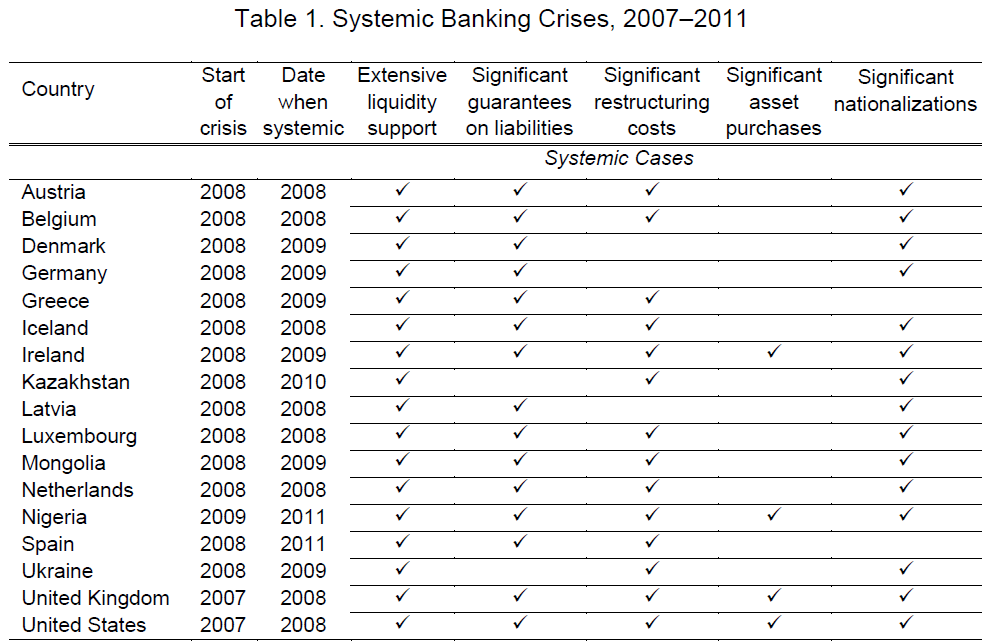
- A valutaválságok 16%-a egyben bankválság is.
- A valutaválságok 16%-a egyben hitelválság is.
- A valutaválságok 71%-a nem terjed át hitel vagy bankválsággá.
- A hitelválságok 56%-a egyben valutaválság is.
- A hitelválságok 26%-a egyben bankválság is.
- A hitelválságok 74%-ban tovább terjednek valutaválsággá és/vagy bankválsággá,.
- A bankválságok 2/3-a nem terjed át hitel vagy valutaválsággá.
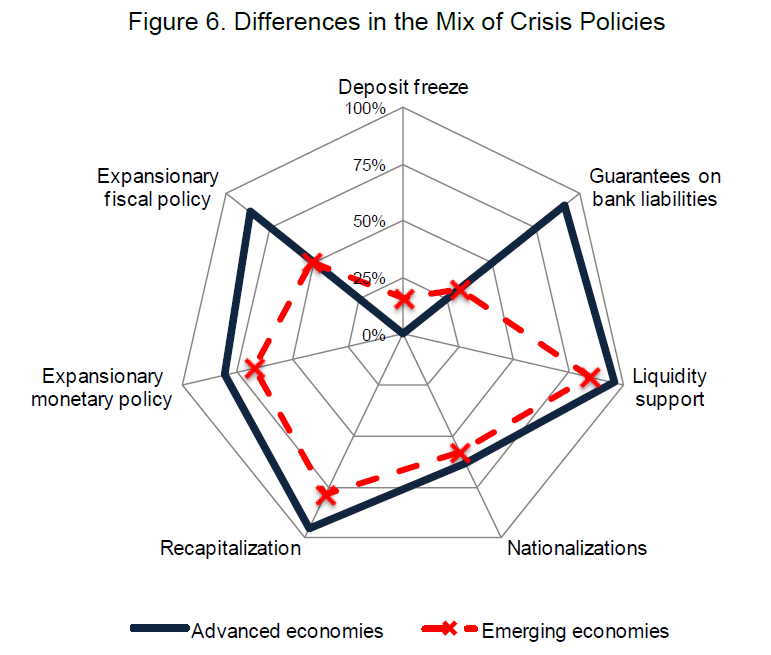
Úgy látszik, hogy a fejlődő országokban hajlamosabbak befagyasztani a bankbetéteket (fejlett országokban ez lehetetlen), ellenben kevésbé törekednek válsághelyzetben az állami kiadások növelésére, továbbá kevésbé vállalnak garanciát a bankok fizetőképességére.
Only a quarter of U.S. adults have more than six months of funds set aside and readily accessible for such disasters; 28% had none at all, according to Bankrate.com.
------
Goods and services from China accounted for only 2.7% of U.S. personal consumption expenditures in 2010, of which less than half reflected the actual costs of Chinese imports. The rest went to U.S. businesses and workers transporting, selling, and marketing goods carrying the “Made in China” label. Although the fraction is higher when the imported content of goods made in the United States is considered, Chinese imports still make up only a small share of total U.S. consumer spending.
How can it only be 2.7% when almost everything in Wal-Mart (NYSE: WMT ) is made in China?” Because Wal-Mart’s $260 billion in U.S. revenue isn’t exactly reflective of America’s $14.5 trillion economy. Wal-Mart might sell a broad range of knickknacks, many of which are made in China, but the vast majority of what Americans spend their money on is not knickknacks.
Americans spent 34% of their income on housing, 13% on food, 11% on insurance and pensions, 7% on health care, and 2% on education. Those categories alone make up nearly 70% of total spending, and are comprised almost entirely of American-made goods and services.
Teljesen logikus, ha megnézzük a legelső ábrát. A gazdaságuk meghatározó részét a services adja, ami nyilván amerikai. Érdekes lenne ezeket az adatok úgy is megnézni, hogy a manufacturing mekkora része van kihelyezve Kínába.
------
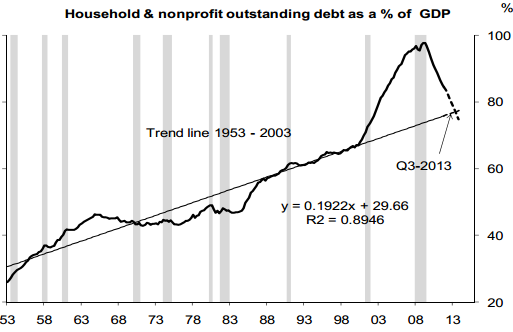
Deutsche Bank's latest research on US consumer leverage suggests that the deleveraging process may have another couple of years to run. They determined the long-term trend line based on consumer debt to GDP ratio from 1953 to 2003, thus excluding the bubble years. Then they compared the current leverage to this line and looked at the rate of convergence. The intersection with the trend line is expected to take place in a year.
-----
